Angularでグラフを簡単に描画したかったので、ng2-chartsとchart.jsを利用した際のメモです。
各種バージョンは以下のとおりです。
- Angular CLI: 12.2.1
- Node: 14.17.4
- ng2-charts: 2.4.3
- chart.js: 2.9.3
TOC
今回の目標とソースコードについて
今回の目標は、ng2-chartsモジュールを使ってAngularからグラフを描画するです。
参考 今回のソースコード
プロジェクトの作成
今回のサンプル用にプロジェクトを作成します。
ng new angular-ng2chart-sample今回使用したAngularのバージョンは以下のとおりです。
{
  "name": "angular-ng2chart-sample",
  "version": "0.0.0",
  "scripts": {
    "ng": "ng",
    "start": "ng serve",
    "build": "ng build",
    "watch": "ng build --watch --configuration development",
    "test": "ng test"
  },
  "private": true,
  "dependencies": {
    "@angular/animations": "~12.2.0",
    "@angular/common": "~12.2.0",
    "@angular/compiler": "~12.2.0",
    "@angular/core": "~12.2.0",
    "@angular/forms": "~12.2.0",
    "@angular/platform-browser": "~12.2.0",
    "@angular/platform-browser-dynamic": "~12.2.0",
    "@angular/router": "~12.2.0",
    "rxjs": "~6.6.0",
    "tslib": "^2.3.0",
    "zone.js": "~0.11.4"
  },
  "devDependencies": {
    "@angular-devkit/build-angular": "~12.2.0",
    "@angular/cli": "~12.2.0",
    "@angular/compiler-cli": "~12.2.0",
    "@types/jasmine": "~3.8.0",
    "@types/node": "^12.11.1",
    "jasmine-core": "~3.8.0",
    "karma": "~6.3.0",
    "karma-chrome-launcher": "~3.1.0",
    "karma-coverage": "~2.0.3",
    "karma-jasmine": "~4.0.0",
    "karma-jasmine-html-reporter": "~1.7.0",
    "typescript": "~4.3.5"
  }
}
ng2-chartsとchart.jsのインストール
ng2-chartsとchart.jsには依存関係があるため、テストされたバージョンをインストールします。ng2-chartsの最新の安定版である2.4.3とそれに合わせてテストされたchart.js 2.9.3を利用します。
参考 利用されているchart.jsのバージョンそれぞれをインストールします。
npm install --save ng2-charts@2.4.3npm install --save chart.js@2.9.3続いて、ChartsModuleを読み込みます。
import { NgModule } from '@angular/core';
import { BrowserModule } from '@angular/platform-browser';
import { ChartsModule } from 'ng2-charts'; // 追加

import { AppComponent } from './app.component';
import { DoughnutChartComponent } from './doughnut-chart/doughnut-chart.component';

@NgModule({
  declarations: [
    AppComponent,
    DoughnutChartComponent
  ],
  imports: [
    BrowserModule,
    ChartsModule // 追加
  ],
  providers: [],
  bootstrap: [AppComponent]
})
export class AppModule { }
これで準備は完了です。
サンプルのグラフを実装
公式ページにあるサンプルを実装していきます。
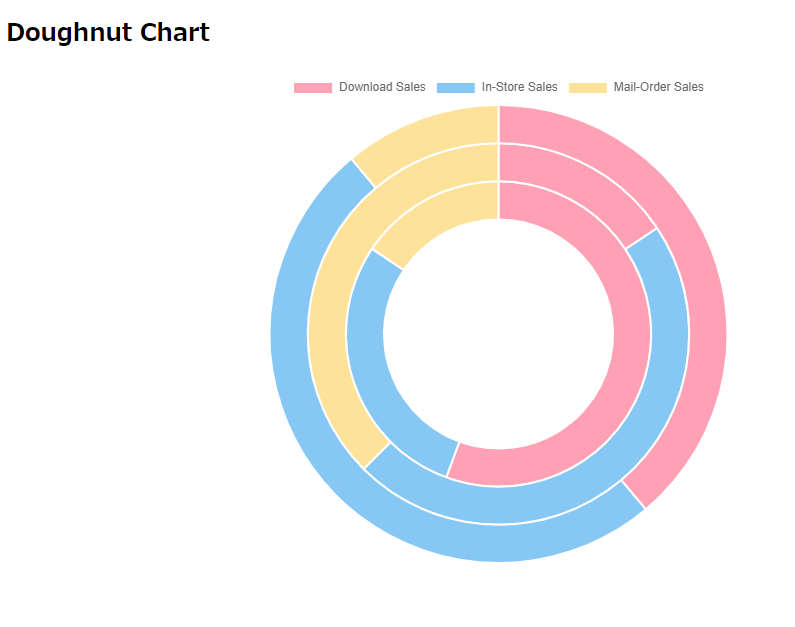
参考 ng2-chartsサンプルの移植例としてDoughnut Chartを使用します。
まず、Doughnut Chartのコンポーネントを作成します。
ng g c doughnut-chartDoughnutChartComponentをトップページに表示するように、app.component.htmlの中身を全て削除して以下のようにします。
<h2> Doughnut Chart</h2>
<app-doughnut-chart></app-doughnut-chart>
続いて、DoughnutChartComponentにサンプルの内容をコピペしていきます。
コンポーネント名を同じにしているので、サンプルのTypeScriptの内容をそのままコピペしています。
import { Component, OnInit } from '@angular/core';
import { ChartType } from 'chart.js';
import { MultiDataSet, Label } from 'ng2-charts';

@Component({
  selector: 'app-doughnut-chart',
  templateUrl: './doughnut-chart.component.html',
  styleUrls: ['./doughnut-chart.component.scss']
})
export class DoughnutChartComponent implements OnInit {
  // Doughnut
  public doughnutChartLabels: Label[] = ['Download Sales', 'In-Store Sales', 'Mail-Order Sales'];
  public doughnutChartData: MultiDataSet = [
    [350, 450, 100],
    [50, 150, 120],
    [250, 130, 70],
  ];
  public doughnutChartType: ChartType = 'doughnut';

  constructor() { }

  ngOnInit(): void {
  }

  // events
  public chartClicked({ event, active }: { event: MouseEvent, active: {}[] }): void {
    console.log(event, active);
  }

  public chartHovered({ event, active }: { event: MouseEvent, active: {}[] }): void {
    console.log(event, active);
  }
}
HTMLはMarkupという内容をコピーしています。
<div>
  <div>
    <div style="display: block">
      <canvas baseChart
        [data]="doughnutChartData"
        [labels]="doughnutChartLabels"
        [chartType]="doughnutChartType">
      </canvas>
    </div>
  </div>
</div>
以上を完了するとトップページにサンプルと同じグラフが描画できるようになっているはずです。
他のグラフもサンプルから移植して、データを入れ替えることでグラフが表示できるようになります。公式には詳しく書かれていませんが他のライブラリを使っているグラフもあるため、バージョンには気をつけてください。